Home » Resources » Research & Data » Deaf College Student Data » Undergraduate Enrollment of Deaf Students in the United States (2019-2020)
Undergraduate Enrollment of Deaf Students in the United States (2019-2020)
Authors: Carrie Lou Bloom and Jeffrey Palmer
After people leave high school, college experiences can be an opportunity for continued growth and learning and becoming more competitive in the workplace. Postsecondary enrollment rates for deaf people have increased since the 1980s, in large part due to legislative action and increased accessibility of educational environments (Newman et al., 2011). Despite increased access to postsecondary education, fewer deaf people complete college degrees than their hearing peers (Bloom, Palmer, & Winninghoff, 2023).
National data show that only 4.9% of deaf adults are currently enrolled in postsecondary institutions of any type, compared to 10.0% of hearing people (Bloom et al., 2023). This report provides a comprehensive overview of undergraduate enrollment of deaf college students in the United States, serving as a resource for community members, advocates, educators, researchers, and policymakers. To develop programs and strengthen services for deaf college students, it is necessary to understand their characteristics and experiences. This report uses the most recent available data from the National Postsecondary Student Aid Study (NPSAS), a comprehensive national study of the characteristics of students in postsecondary education who identify as deaf or who have serious difficulty hearing.
Key Findings
Enrollment
- An estimated 237,000 deaf students are enrolled in college.
- Deaf students are older and take longer to enroll in college after high school than hearing students.
- A higher percentage of deaf students take classes online.
- Most deaf students pursue associate’s and bachelor’s degrees.
Identity
- A higher percentage of deaf students identify as gender nonconforming than hearing students.
- A lower percentage of deaf students are Black than hearing students.
- Almost half of deaf college students have an additional disability.
- A higher percentage of deaf students are married or care for a child.
- A higher percentage of deaf students are first-generation students.
Academics & Coursework
- Deaf students receive less financial aid than their hearing counterparts.
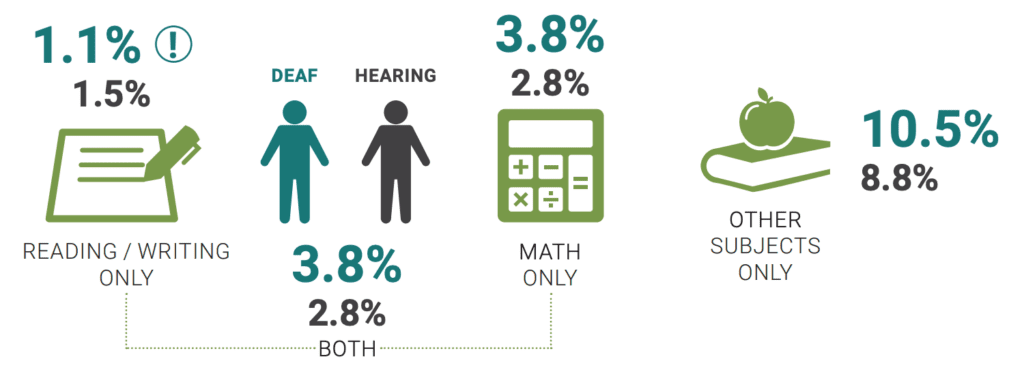
- A higher percentage of deaf students take developmental coursework than hearing students.
- The most popular fields of study for deaf students are healthcare, business, and the humanities.
Characteristics of Deaf Students
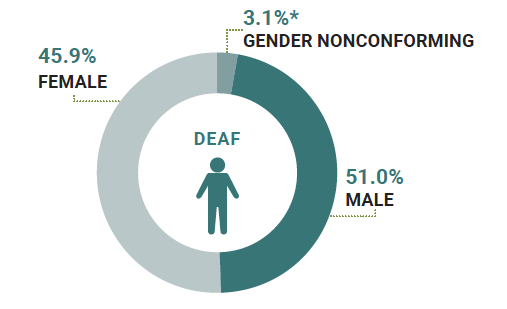
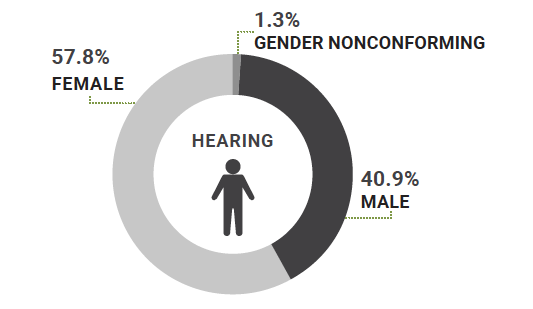
Among all college students enrolled in the 2019–2020 academic year, 19.5% report having a disability. The most prevalent disabilities reported are depression; mental, emotional, or psychiatric conditions; and attention-deficit disorder. Altogether, 1.4% of all college students are deaf. This means that an estimated 237,000 deaf students are enrolled in college. More deaf men (51.0%) than deaf women (45.9%) are enrolled in college. For hearing people, the opposite is true—more women than men are enrolled in college. However, we know that more deaf women complete college degrees than deaf men (Bloom et al., 2023). There is a significantly higher percentage of gender-nonconforming deaf students (3.1%) than hearing students (1.3%).
Enrolled Students by Gender
Enrolled Students by Race & Ethnicity
* Indicates that the difference between hearing and deaf students is statistically significant.
! Interpret data with caution. Estimate is unstable because the standard error represents more than 30%.
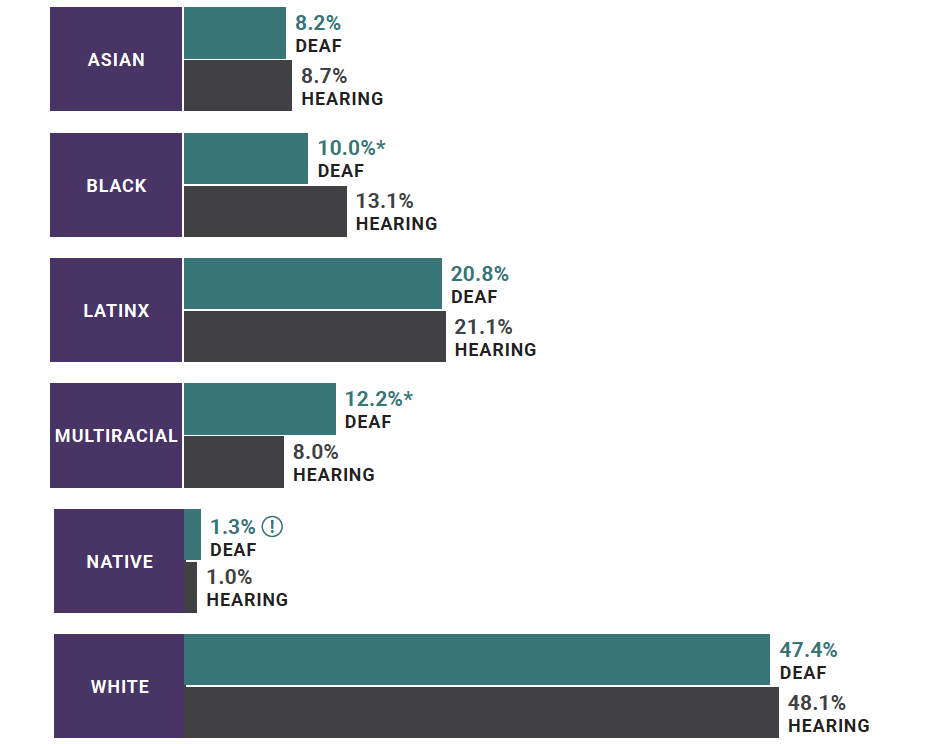
The overall percentages of hearing and deaf students by race and ethnicity are very similar. For example, among deaf people enrolled in college, 47.4% are white, compared to 48.1% of their hearing peers. However, Black deaf students are significantly underrepresented; only 10.0% of deaf students are Black versus 13.1% of hearing students. A significantly higher percentage of deaf students (12.2%) identify with more than one race (multiracial) than hearing students (8.0%). This finding suggests that greater recruitment and retention efforts are needed to increase the number of Black deaf students attending postsecondary institutions.
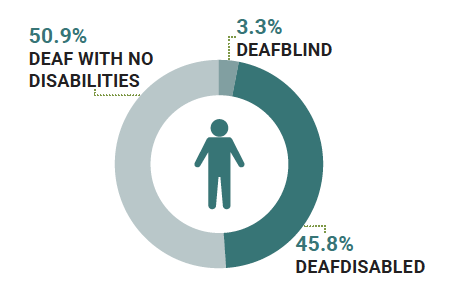
Nearly half of all deaf college students are deafdisabled, 3.3% are deafblind, and 50.9% are deaf with no additional disabilities.
The most common other disabilities among deaf students are depression, other, mental health, and attention-deficit disorder. The incidence of learning and mental health disabilities is significantly lower among deaf students than among hearing students. Colleges need to be aware that deaf students may be largely underdiagnosed due to inaccessible mental health evaluation and support services (Gallagher, 2022). Brain injuries also affect a significantly higher percentage of deaf students than hearing students; this finding may be due in part to the significantly higher percentage of deaf students who are veterans.
| Deaf | Hearing | |
|---|---|---|
|
Attention-Deficit Disorder |
5.2%* |
21.7% |
|
Brain Injury |
37%* |
1.5% |
|
Depression |
9.8%* |
28.5% |
|
Mental, Emotional, or Psychiatric Condition |
7.6%* |
21.6% |
|
Orthopedic or Mobility Impairment |
3.6% |
3.2% |
|
Other |
8.6%* |
11.9% |
* Indicates that the difference between hearing and deaf students is statistically significant.
For more information on the breakdown on student demographics and additional charts, please view the full report.
Undergraduate Degree Enrollment of Deaf College Students
Since 2011, the total number of enrolled postsecondary students has remained relatively unchanged (Bloom et al., 2023). Employment rates are much higher for deaf people with any type of degree (Bloom et al., 2023), suggesting that postsecondary education and training remains an important avenue to improve outcomes for deaf people. Compared to hearing students, a significantly higher percentage of deaf students are enrolled in certificate programs (12.0% vs. 7.0%) and a significantly lower percentage are enrolled in bachelor’s degree programs (45.8% vs. 54.8%). Deaf and hearing students are enrolled in associate’s programs at similar rates. Additionally, across gender, we see slight differences in degree goals.
Degree Enrollment by Gender
Degree Enrollment by Age
Degree Enrollment by Race
Financial Support for Deaf Students
For many college students, financial aid is an important factor that contributes to the likelihood of attending college and continuing coursework to complete their programs. Financial aid can come from multiple sources: loans, grants, vocational rehabilitation, work study programs, and more. The average financial aid received in the 2019–2020 academic year is $1,466 lower for deaf students than hearing students ($8,608 vs. $10,074). When examining the financial aid gaps between deaf and hearing students, it is necessary to ask whether deaf students are equally informed about available financial aid options and the application process for federal financial aid. In the United States, 30.3% of deaf students have never applied for any form of federal aid, in contrast to 28.4% of hearing students.
DEAF
$8,608
HEARING
$10,074
College Experiences of Deaf Students
Most students work while attending college—70.7% of deaf students work, compared to 73.0% of hearing students. Among deaf students with a job, 37.4% have jobs related to their college major or field of study, compared to 32.8% of hearing students. These jobs are primarily regular jobs, not work-study jobs; only 2.7% of deaf students have a work-study job, compared to 5.0% of hearing students. A higher percentage of deaf students (61.2%) live off campus than hearing students (51.2%), which may make it more difficult for deaf students to connect with peers on campus and seek help when needed. Deaf students are just as likely as hearing students to study abroad at any time during their undergraduate education (6.2% vs. 5.9%). Deaf students have an average GPA of 3.02, and hearing students have an average GPA of 3.15.
College Trajectory of Deaf Students
Deaf students may be less prepared for college for many reasons, including a lack of academic support during high school and an extended period of time between high school completion and college enrollment. On average, deaf students enroll in college 3.7 years after completing high school, compared to 1.5 years for hearing students. Many students need developmental coursework upon arriving at college. A significantly higher percentage of deaf students take developmental coursework at some point while enrolled in college than hearing students (37.1% vs. 28.0%). However, in 2019–2020, deaf college students took developmental courses at roughly similar rates as hearing students.
Deaf students generally have high expectations about pursuing their education, at rates similar to their hearing peers. When students were asked about the highest level of education they expected to complete, deaf students responded optimistically, with 45.2% expecting to complete a bachelor’s degree and 10.7% expecting to complete a doctoral degree. However, a smaller percentage of deaf students complete their program of study than hearing students, which suggests that factors outside of deaf students’ control may serve as obstacles to their educational goals. Postsecondary institutions need to ensure that they are ready to meet the needs of deaf students (Cawthon, Schoffstall, & Garberoglio, 2014).
! Interpret data with caution. Estimate is unstable because the standard error represents more than 30%.
| 2011-2012 | 2015-2016 | 2019-2020 | |
|---|---|---|---|
|
Estimated Total Number |
270,184 |
233,738 |
231,726 |
|
Percentage of All Students Who Are Deaf |
1.2% |
1.3% |
1.4% |
|
Enrolled in Certificate Program |
16.4% |
11.0% |
12.0% |
|
Enrolled in Associate’s Program |
49% |
51.8% |
42.1% |
|
Enrolled in Bachelor’s Program |
34.6% |
37.2% |
45.8% |
|
Entire Program Online |
N/A |
17.1% |
29.7% |
|
Ever Attended 4-Year Institution |
53.1% |
60.4% |
72.4% |
|
Ever Taken Developmental Course |
35.4% |
41.7% |
37.1% |
Institutional Characteristics
Deaf students enroll in many different types of institutions, including private, public, in-state, out-of-state, 4-year, 2-year, nonprofit, and for-profit institutions. A significantly higher percentage of deaf students enroll in private, for-profit institutions than hearing students (13.6% vs. 7.8%). A higher percentage of deaf students (21.3%) attend an out-of-state college than hearing students (18.0%). Deaf students may seek colleges with better services and accommodations or more deaf students. Community colleges are an important part of the postsecondary experience, providing additional support and opportunities to earn certificates and associate’s degrees. The majority (70.8%) of deaf students had attended a community college, which is a significantly higher rate than their hearing counterparts (61.7%). Deaf students are just as likely to enroll in Historically Black Colleges and Universities as hearing students (1.3%! vs. 1.4%).
For more information, additional charts and graphs, and the methods section of this report, please view the full report below.
To access our 2016-2017 Undergraduate Student Enrollment Report, please visit the UT Repository.
References
Bloom, C. L., Palmer, J. L., & Winninghoff, J. (2023). Deaf postsecondary data from the American Community Survey [Data visualization tool]. National Deaf Center on Postsecondary Outcomes, The University of Texas at Austin. https://nationaldeafcenter.org/dashboard
Cawthon, S. W., Schoffstall, S. J., & Garberoglio, C. L. (2014). How ready are postsecondary institutions for students who are d/Deaf or hard-of-hearing? Education Policy Analysis Archives, 22(13), 1–22. https://doi.org/10.14507/epaa.v22n13.2014
Gallagher, G. M. (2022). Prevalence of self-reported communication experiences and common DSM-5 diagnoses among a clinical sample of deaf and hard of hearing university students (Publication No. 2845001115) [Doctoral Dissertation, Gallaudet University]. ProQuest Dissertations & Theses Global.
National Deaf Center on Postsecondary Outcomes. (2019). Supporting deaf veterans. National Deaf Center on Postsecondary Outcomes, The University of Texas at Austin. https://nationaldeafcenter.org/deafveterans
Newman, L., Wagner, M., Knokey, A.-M., Marder, C., Nagle, K., Shaver, D., & Schwarting, M. (2011). The post-high school outcomes of young adults with disabilities up to 8 years after high school: A report from the National Longitudinal Transition Study-2 (NLTS2) (NCSER 2011–3005). SRI International.
Palmer, J. L., Cawthon, S. W., Garberoglio, C. L., & Ivanko, T. (2020). ACCESS is more than accommodations: 2018–2019 deaf college student national accessibility report. National Deaf Center on Postsecondary Outcomes, The University of Texas at Austin. https://nationaldeafcenter.org/podreport
The National Deaf Center on Postsecondary Outcomes is a technical assistance and dissemination center supported by a cooperative agreement with the U.S. Department of Education’s Office of Special Education Programs (#H326D210002). However, the contents of this report do not necessarily represent the positions or policies of the federal government
Recommended Citation
https://nationaldeafcenter.org/enrollmentdata2023.