There are about 280,000 deaf young people in the United States between the ages of 16 and 24.
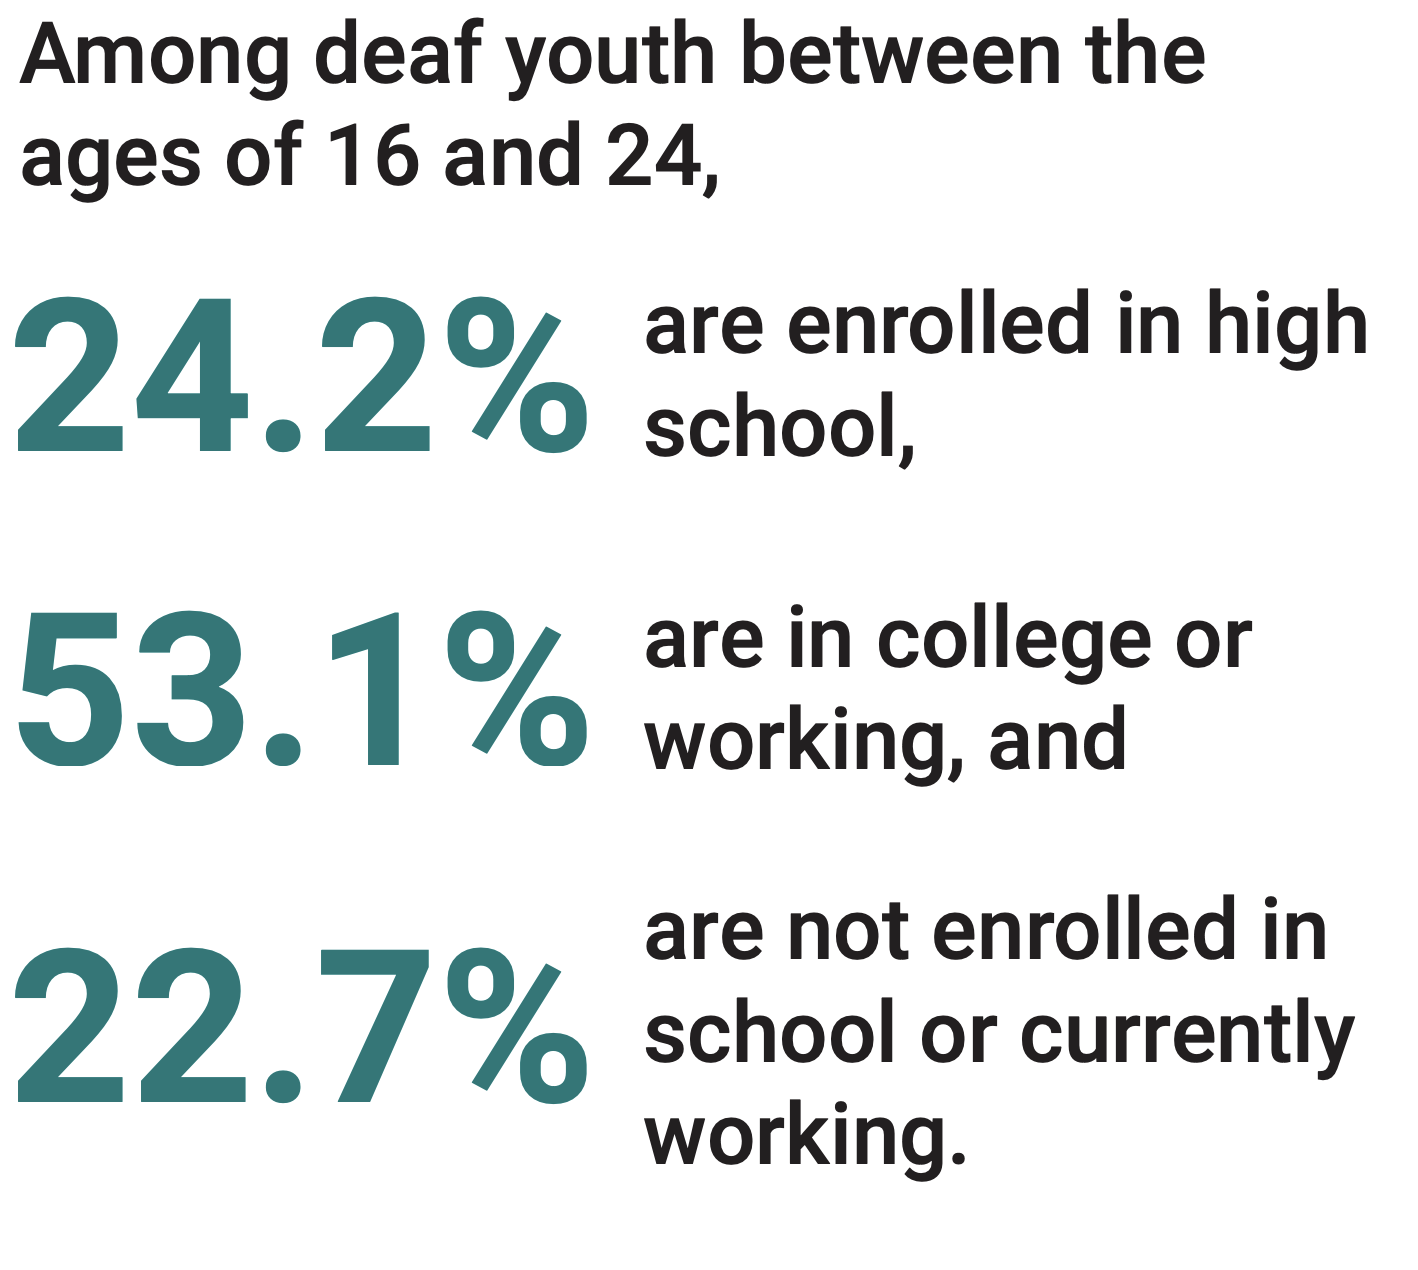
Deaf young people in the United States who are between the age of 16 and 24 are a highly diverse group – while some of them are still in high school, many are working or continuing their education. However, more deaf youth are not working or going to school, compared to hearing people in the same age group. This is an opportunity to improve systems of support so more deaf youth have equitable access in school and the workplace.
What Do We Know About Deaf Young People?
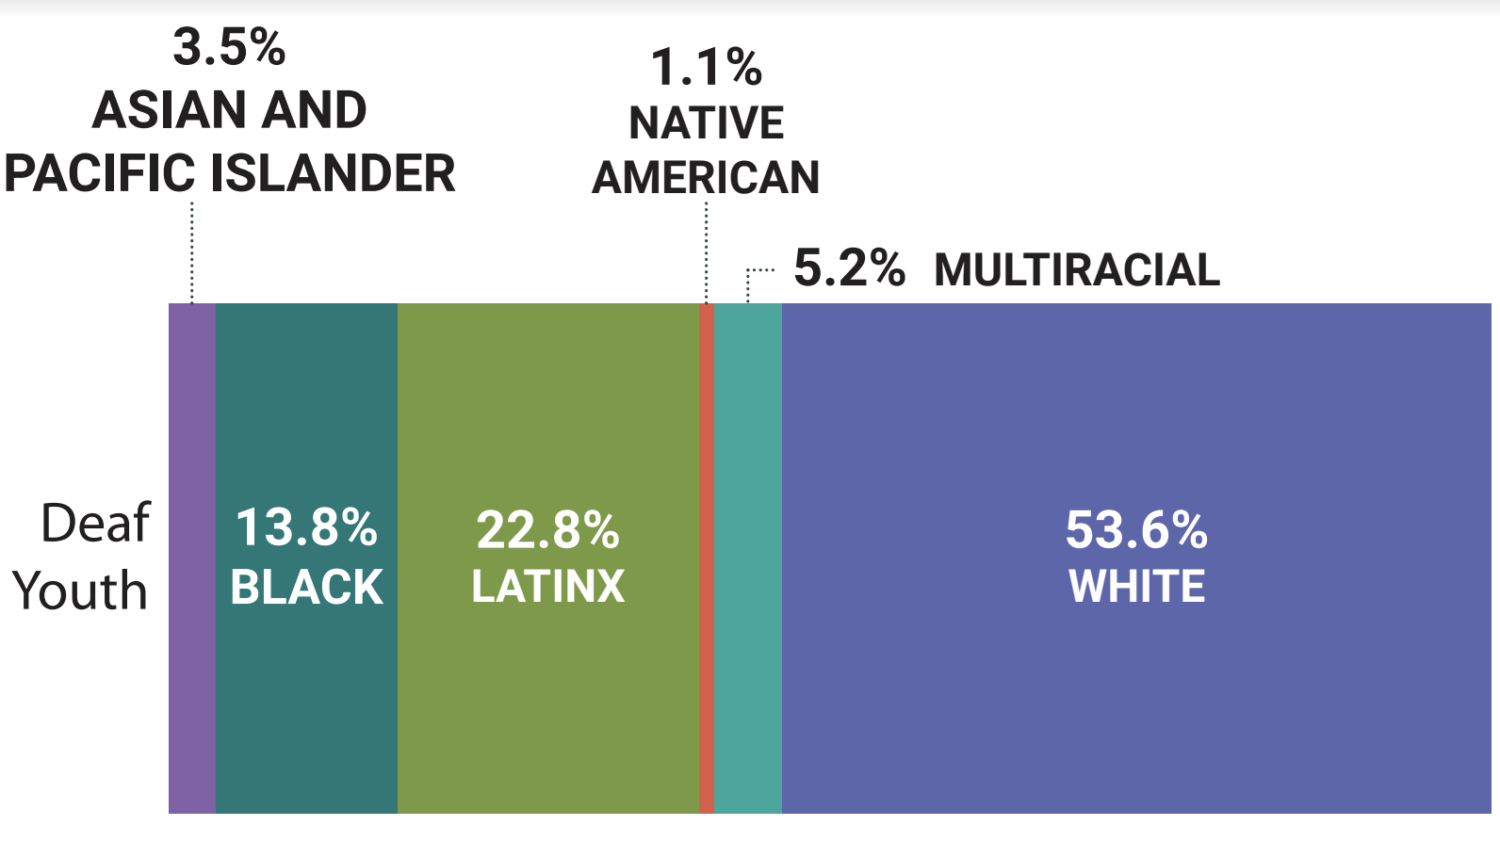
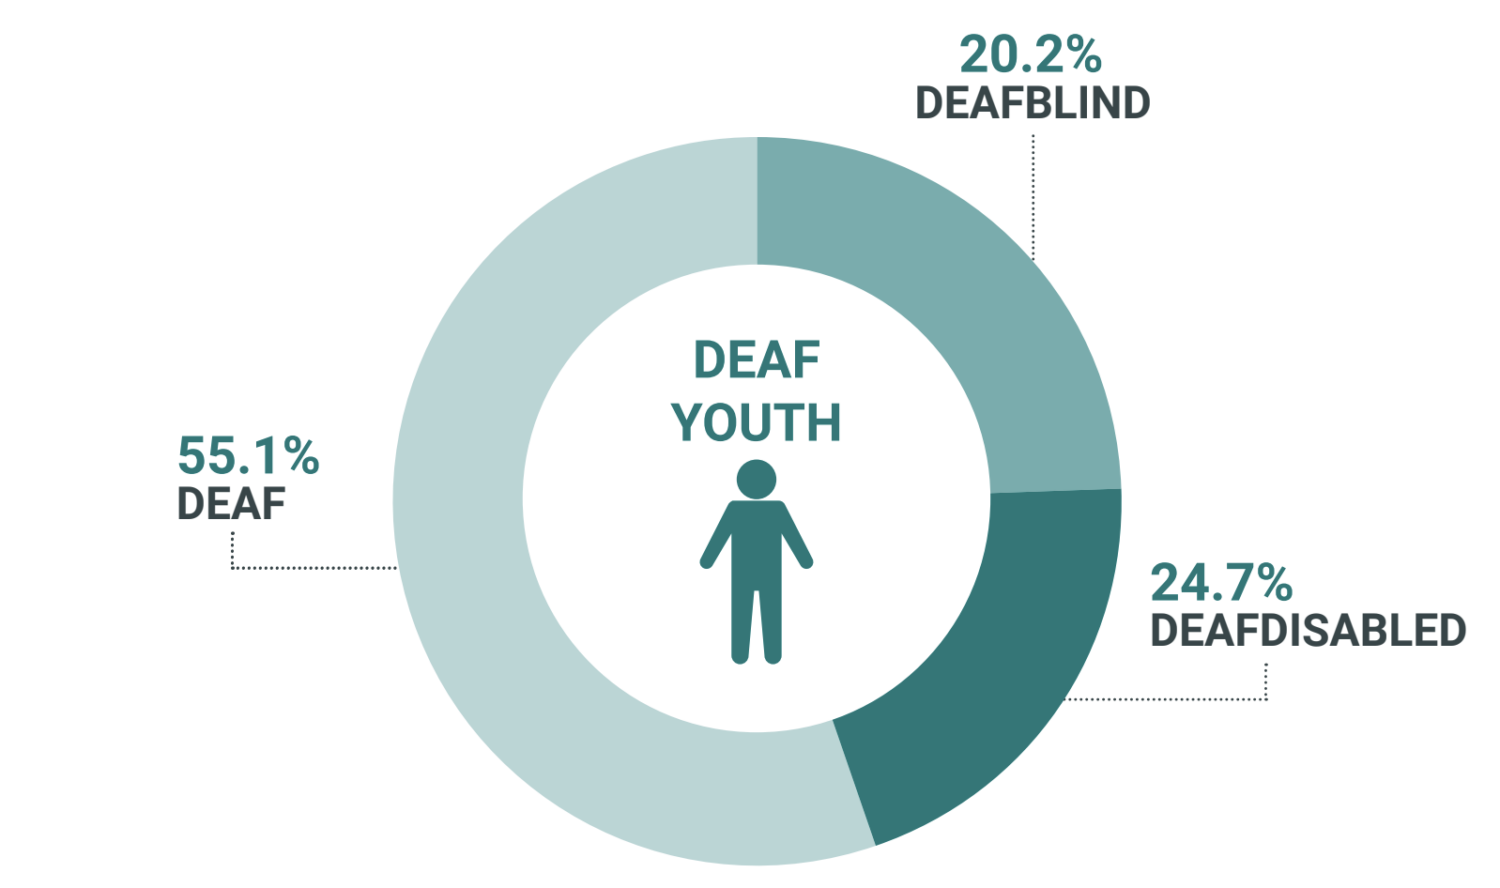
There are an estimated 280,000 deaf young people ages 16-24 living in the United States. They are more racially and ethnically diverse than older deaf people, more likely than their hearing peers to live in households where no one is working, and nearly half have an additional disability.
Click on any image to enlarge.
(A bar chart shows the racial makeup of deaf youth; 3.5% Asian and Pacific Islander, 13.8% Black, 22.8% Latinx, 1.1% Native American, 5.2% Multiracial, 53.6% White)
(A donut chart with an icon of a person shows percentages of deaf youth; 55.1% are deaf, 20.2% are deafblind, 24.7% are deafdisabled)
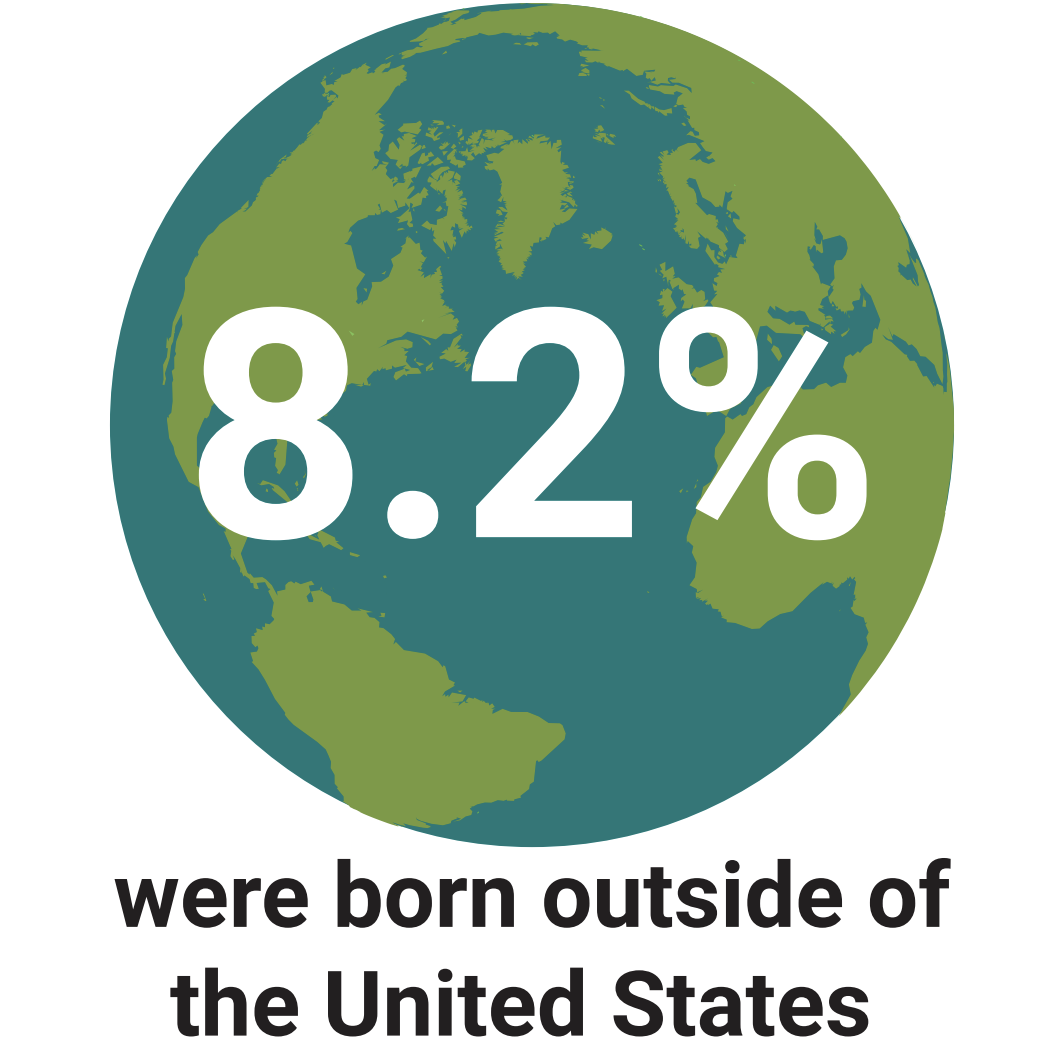
(An illustration of Earth is under the text: "8.2%" with further text beneath that reads "were born outside of the United States")
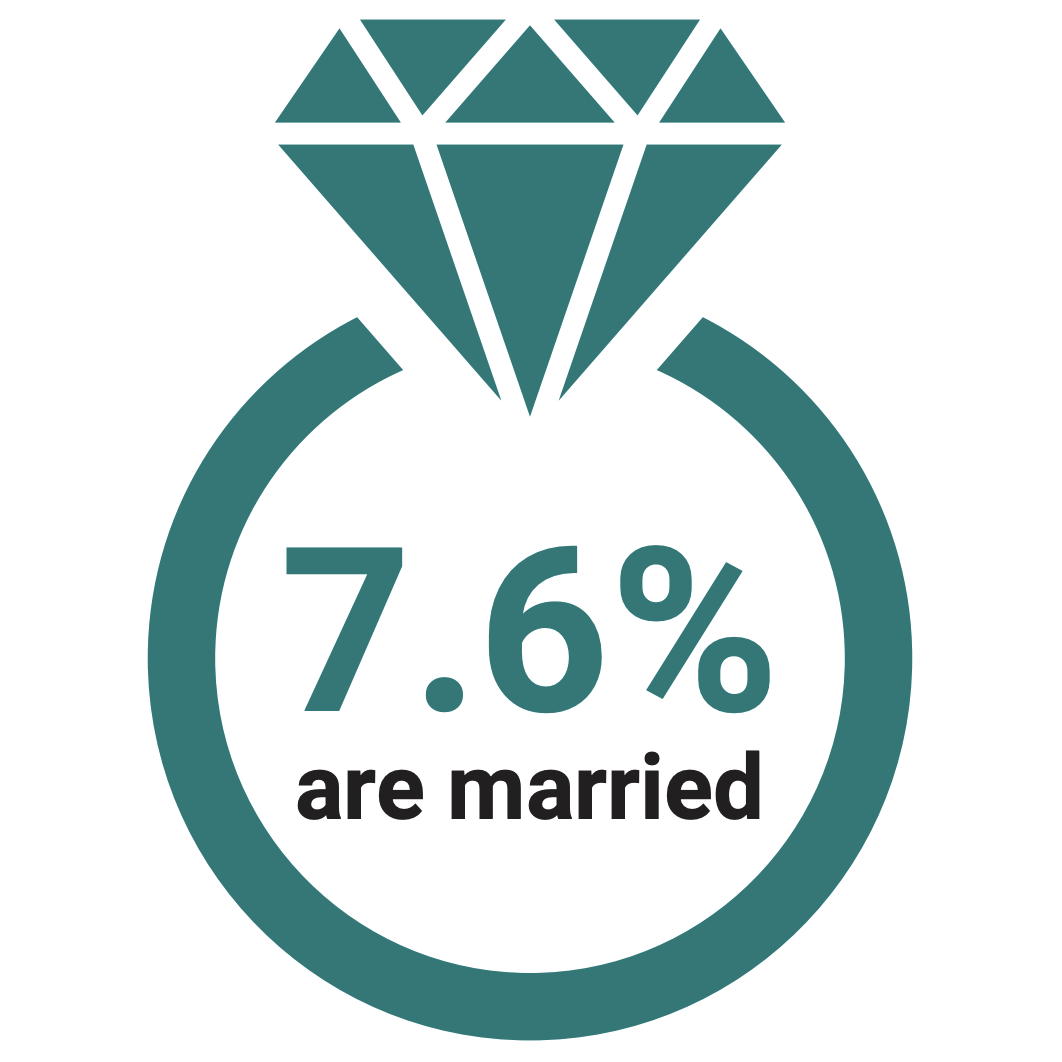
An illustration of a diamond ring with text: "7.6% are married")
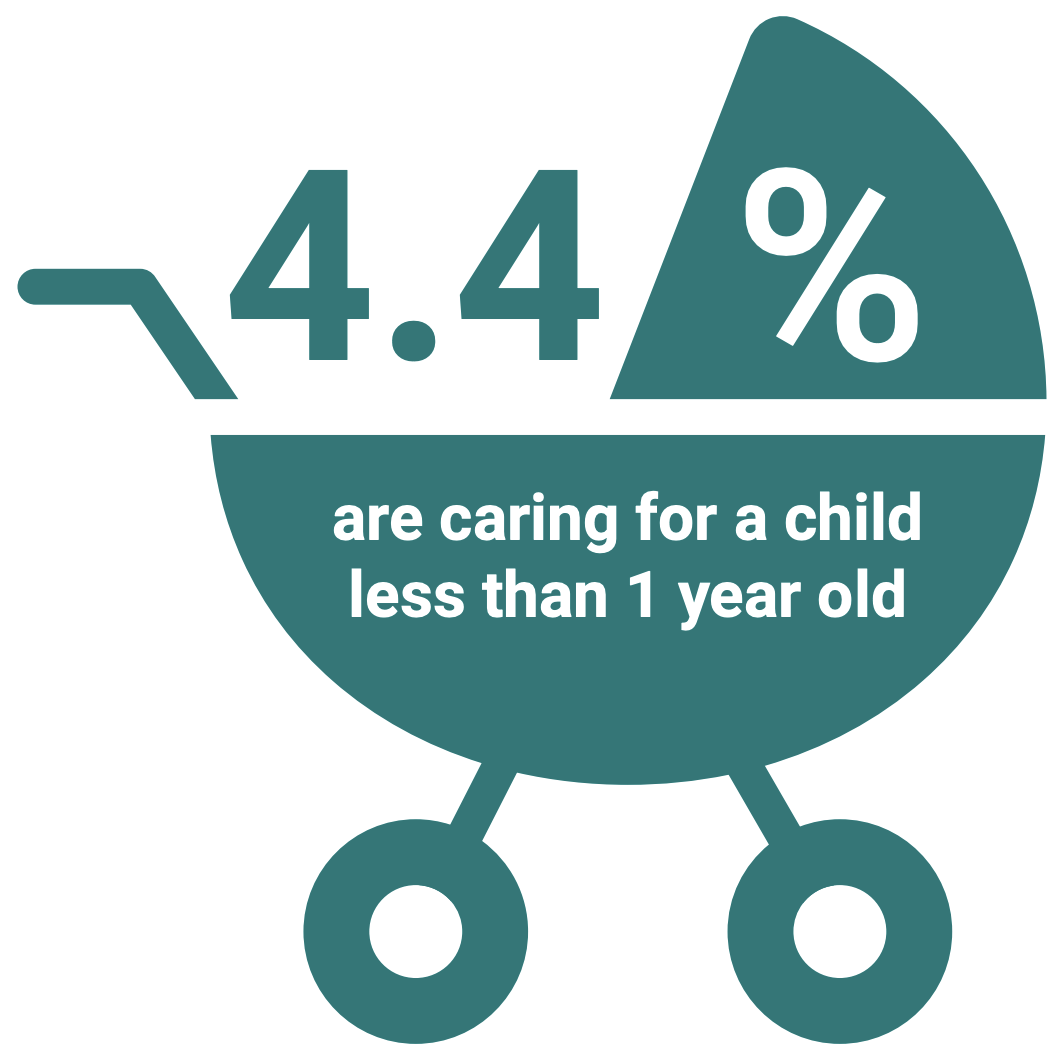
(An illustration of a baby carriage with text: "4.4% are caring for a child less than 1 year old")
(An illustration of a building and text: "3.0% receive SSI or SNAP benefits")
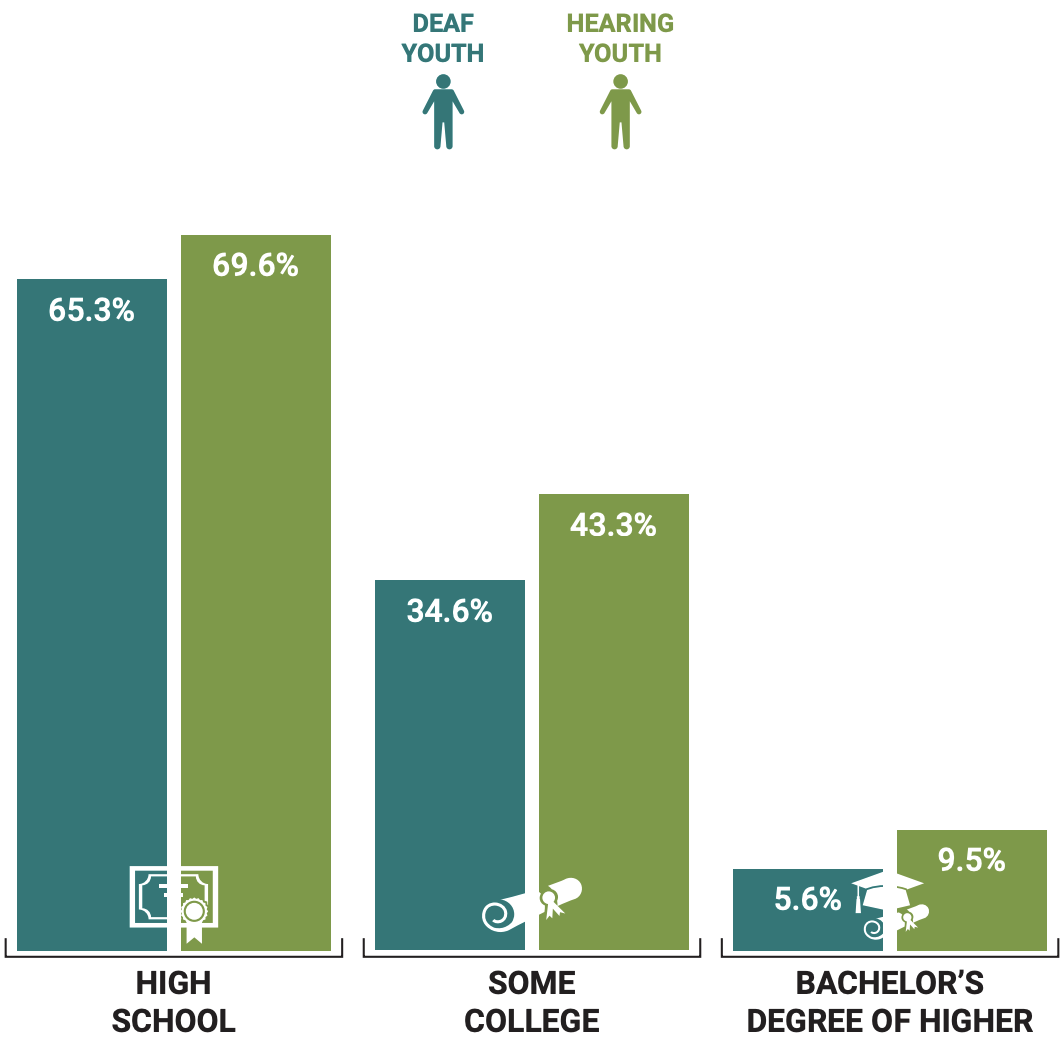
Fewer deaf youth have completed high school, some college, or a bachelor’s degree than their hearing peers.
(A bar chart shows differences between deaf youth and hearing youth. High School: 65.3%, 69.6%; Some College: 34.6%, 43.3%; Bachelor's Degree or Higher: 5.6%, 9.5%)
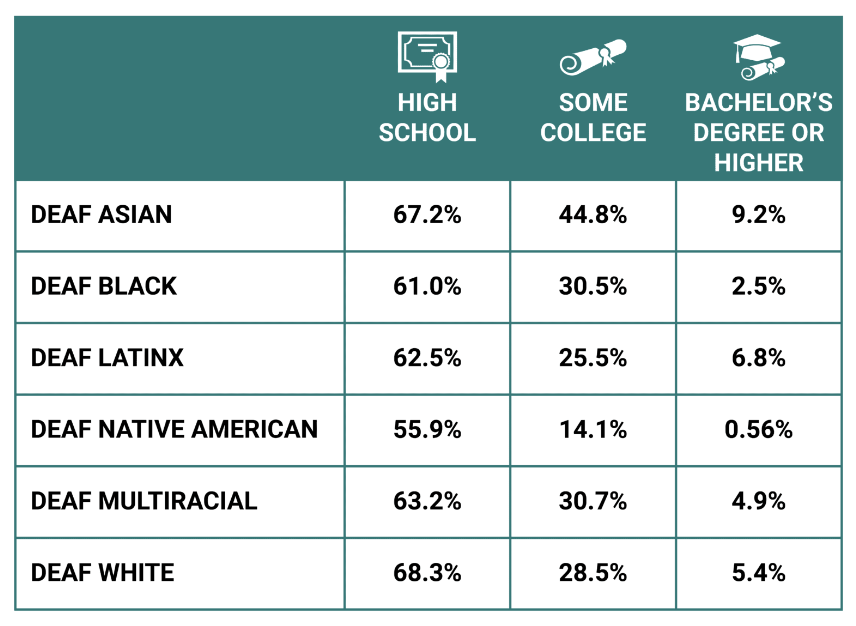
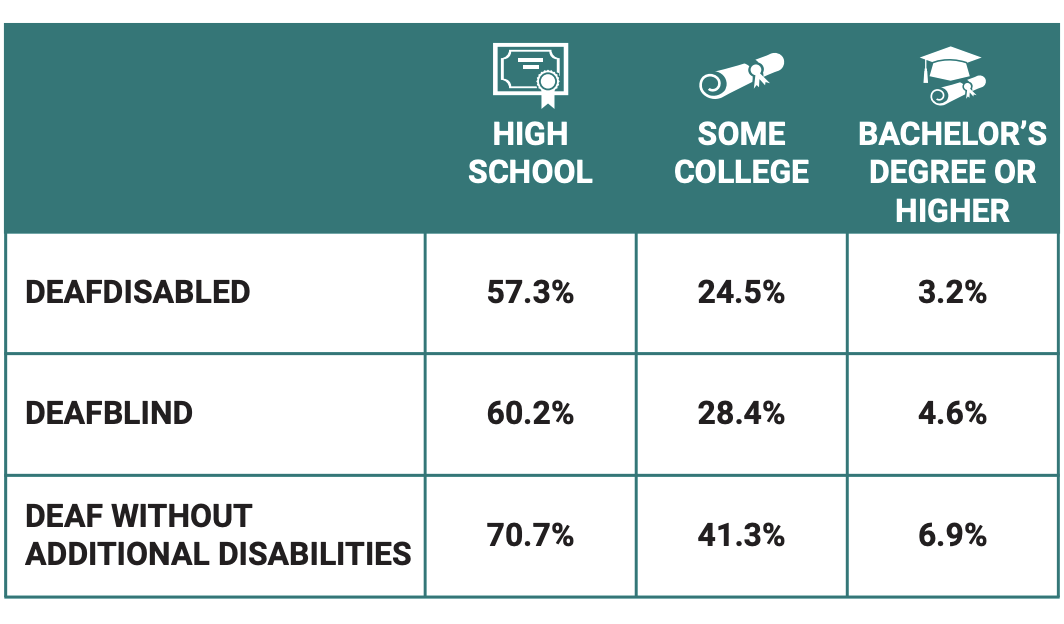
Deaf youth who are BIPOC, deafdisabled, and deafblind face more barriers in educational systems, as demonstrated by educational completion rates.
(Table showing percentages of completion for various racial backgrounds in high school, some college, and bachelor's degree or higher. deaf Asian: 67.2%, 44.8%, 9.2%; deaf Black: 61.0%, 30.5%, 2.5%; deaf Latinx: 62.5%, 25.5%, 6.8%; deaf Native American: 55.9%, 14.1%, 0.56%; deaf multiracial: 63.2%, 30.7%, 4.9%; deaf White: 68.3%, 28.5%, 5.4%)
(Table showing percentages of completion for deaf, deafdisabled, and deaf without additional disabilities in high school, some college, and bachelor's degree or higher. deafdisabled: 57.3%, 24.5%, 3.2%; deafblind: 60.2%, 28.4%, 4.6%; deaf without additional disabilities: 70.7%, 41.3%, 6.9%)
It’s important to remember that deaf youth are not all the same—they have different backgrounds and experiences. Unfortunately, fewer deaf young people are completing high school, attending college, or earning a bachelor’s degree compared to their hearing peers. This is even more challenging for deaf youth who are BIPOC, deafdisabled, or deafblind, as they face additional barriers in the education system, leading to lower completion rates. To support this diverse population, we need to find ways to ensure that our programs are inclusive and accessible. It’s crucial to identify and address the gaps in our current support systems to ensure we are uplifting transition-age youth.
How Engaged Are Deaf Youth in Postsecondary Experiences?
When young adults are neither enrolled in school nor employed, they are often referred to as “disconnected youth” or “opportunity youth.” Examining this group closely allows us to gain insights on how to effectively engage young people and provide them with equal opportunities for ongoing education and work experience.
Deaf Black and Indigenous or Native American people, as well as deafblind and deafdisabled people, experience the highest rates of disconnection. Disconnected deaf youth are also likely to be a caregiver for an infant, rely on government assistance, and do not have access to the internet.
It is crucial to understand that being disconnected during early adulthood has significant long-term impact on earnings, education, and overall well-being. Deaf youth who are Black and Indigenous or Native American people, deafblind people, and deafdisabled people need more support getting reconnected with postsecondary opportunities. By addressing this issue and implementing strategies to support these people, we can help foster a more promising future for all young adults.
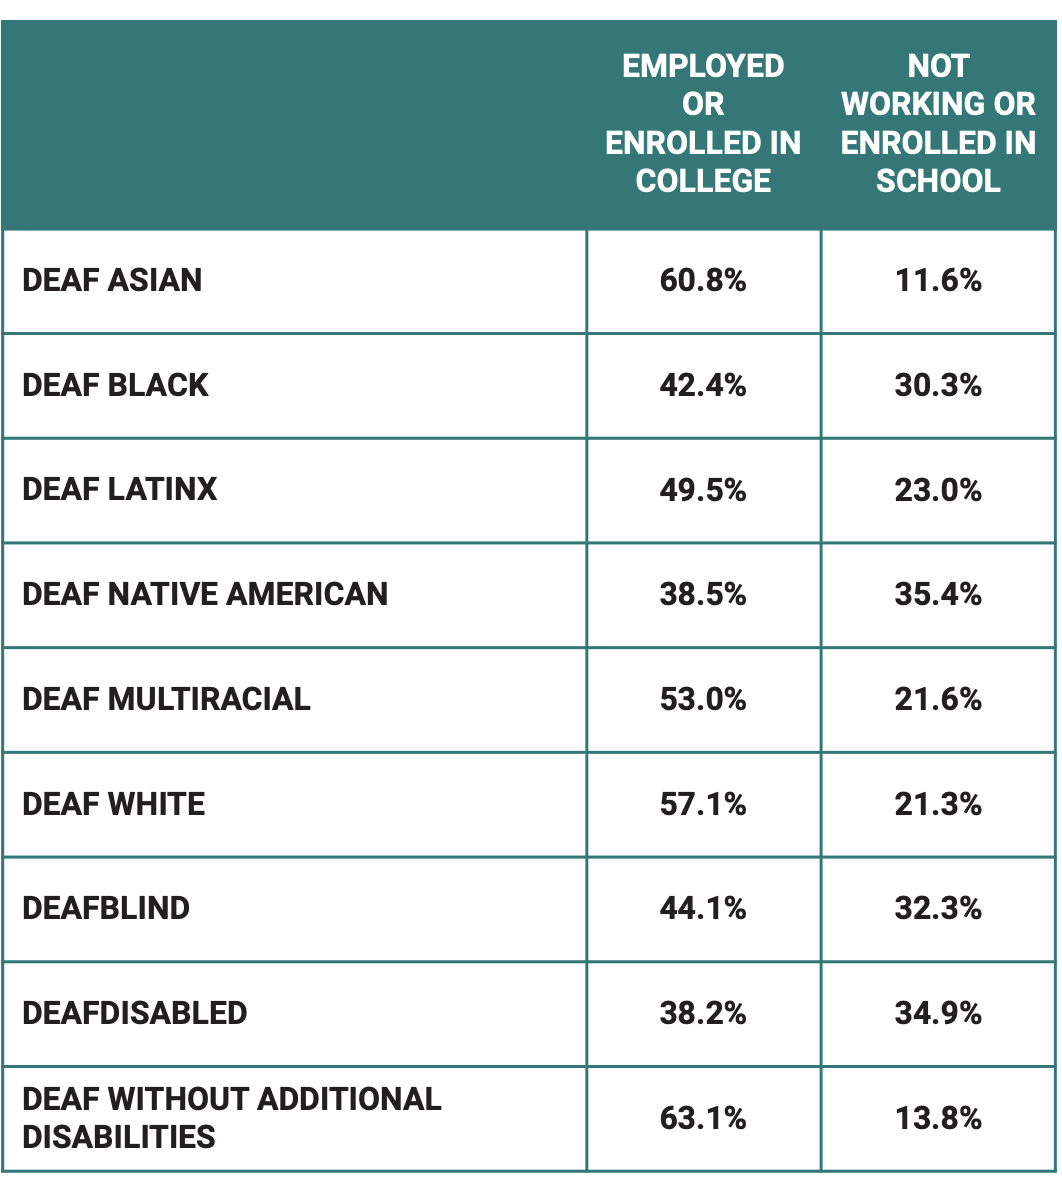
Postsecondary enrollment and employment data for deaf youth age 16-24 (varies by race, ethnicity, and disability)
(Table showing various racial backgrounds and percentages of employed or enrolled in college and not working or enrolled in college. deaf Asian: 60.8%, 11.6%; deaf Black 42.4%, 30.3%; deaf Latinx: 49.5%, 23.0%; deaf Native American: 38.5%, 35.4%; deaf multiracial: 43.0%, 21.6%; deaf White: 57.1%, 21.3%; deafblind: 44.1%, 32.3%; deafdisabled: 38.2%, 34.9%; deaf without additional disabilities: 63.1%, 13.8%)
Please note that the percentages provided do not add up to 100%, as a portion of the population mentioned is still attending high school.
The data in this report comes from the American Community Survey (ACS), which is a yearly survey conducted by the U.S. Census Bureau. It gives us the most up-to-date information about education trends for deaf people in the United States. We used survey participants who identified as deaf or having serious difficulty hearing to represent the deaf population in our analyses. These estimates are based on a sample of 12,181 deaf people between the ages of 16 and 24 from 2017 to 2021. For additional details, please refer to our FAQs page that provides more information about the ACS data.
Recommended Citation
National Deaf Center. (2023). Deaf youth: Exploring who they are and their postsecondary journey. University of Texas at Austin, National Deaf Center on Postsecondary Outcomes. www.nationaldeafcenter.org/deafyouthdata.
XWe use cookies on our website to give you the most relevant experience by remembering your preferences and repeat visits. By clicking “Accept All”, you consent to the use of ALL the cookies. However, you may visit "Cookie Settings" to provide a controlled consent.Read MoreCookie SettingsReject AllAccept
Manage consent
Privacy Overview
This website uses cookies to improve your experience while you navigate through the website. Out of these, the cookies that are categorized as necessary are stored on your browser as they are essential for the working of basic functionalities of the website. We also use third-party cookies that help us analyze and understand how you use this website. These cookies will be stored in your browser only with your consent. You also have the option to opt-out of these cookies. But opting out of some of these cookies may affect your browsing experience.
Necessary cookies are absolutely essential for the website to function properly. These cookies ensure basic functionalities and security features of the website, anonymously.
Cookie
Duration
Description
cookielawinfo-checkbox-analytics
11 months
This cookie is set by GDPR Cookie Consent plugin. The cookie is used to store the user consent for the cookies in the category "Analytics".
cookielawinfo-checkbox-functional
11 months
The cookie is set by GDPR cookie consent to record the user consent for the cookies in the category "Functional".
cookielawinfo-checkbox-necessary
11 months
This cookie is set by GDPR Cookie Consent plugin. The cookies is used to store the user consent for the cookies in the category "Necessary".
cookielawinfo-checkbox-others
11 months
This cookie is set by GDPR Cookie Consent plugin. The cookie is used to store the user consent for the cookies in the category "Other.
cookielawinfo-checkbox-performance
11 months
This cookie is set by GDPR Cookie Consent plugin. The cookie is used to store the user consent for the cookies in the category "Performance".
viewed_cookie_policy
11 months
The cookie is set by the GDPR Cookie Consent plugin and is used to store whether or not user has consented to the use of cookies. It does not store any personal data.
Functional cookies help to perform certain functionalities like sharing the content of the website on social media platforms, collect feedbacks, and other third-party features.
Performance cookies are used to understand and analyze the key performance indexes of the website which helps in delivering a better user experience for the visitors.
Analytical cookies are used to understand how visitors interact with the website. These cookies help provide information on metrics the number of visitors, bounce rate, traffic source, etc.
Advertisement cookies are used to provide visitors with relevant ads and marketing campaigns. These cookies track visitors across websites and collect information to provide customized ads.